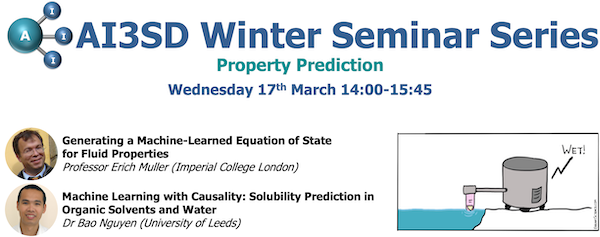
This seminar was the seventh of ten in our AI3SD Winter Seminar Series. This seminar was hosted online via a zoom webinar. The event was themed around Property Prediction, and consisted of two talks on this subject. Below are the videos of the talks with speaker biographies, and the full playlist of this seminar can be found here.
Generating a Machine-Learned Equation of State for Fluid Properties – Professor Erich Müller (Imperial College London)
Erich A Müller currently works as a Professor of Thermodynamics at the Department of Chemical Engineering, Imperial College London. Erich does research in Molecular simulation, Chemical Engineering and Thermodynamics.
Q & A Session
Q1: Why did you choose tanh for the activation function, rather than a rectified linear unit?
I’ll tell you that the problem itself turned out to be much easier than we thought. So, we did look at several options and we just used that one for simplicity rather than anything else. We played around with several activation functions and we ended up with a conclusion that they were all doing exactly the same, so just used that one for no particular reason or no particular advantage.
Q2: How did you choose the number of parameters in the hidden layers? One slide showed (15, 10, 5) and another showed (48, 24, 12). Why was there this difference?
There is a difference because we broke the problem down into three different problems one was for the critical point, the other one was the vapor pressure point and the other one is the one phase region. Each one of these the problems was slightly different in their difficulty. The case of the critical point, it turned out to be much easier and required much less fitting, while others were a little bit more complicated. Also, note that there is a difference in not only in the inputs, but also in the outputs. In the case of the the critical points, we just had two outputs and in the case of the vapor pressure, we have three outputs, which are the pressure, and the two densities. So, then definitely you need more elements in these layers. But, there’s no magic in these numbers, we just tried a few numbers and eventually recognized that these numbers tended to give good results. I’m completely convinced that between 15, 10 and 5, and maybe another choice 20, 15 and 10, you wouldn’t probably see much of a difference.
Q3: If I have some experience in VLE data processing and some knowledge about machine learning on Python, what step could you recommend me to make forward to combine these two topics?
I’m not sure I understand the question. Basically, to combine the two topics, well, that’s actually what we were doing here. If you’re talking more about general data processing or general thermophysical data processing, I think one has to realize, and I’ll be quite blunt here, that machine learning is, at this point, really correlating the data so just think about what if you had a data set and you’re fitting it with a polynomial, what would you need? Well, you would need a good data set. You would need to know the inaccuracies of your data and you would need to be reasonably careful with the polynomial not to overfit your data, but to use the simplest type of polynomial you would want to fit that data. So, what we are gaining with the machine learning approaches, is an enormous capability in processing more data. Finding relationships between data which are not obvious in our case, for example, we went from the Lennard Jones fluid all the way to any type of fluid spanning from small molecules to big molecules. Theoretically that’s very complicated, but the neural network figured it out and worked out the relationship directly. So, the real value I think is in 1) used in massive amounts of data, for some reason you know, because they exist etc. and 2) finding relationships between things which are hard to relate to. For example, if you want to look at interfacial tensions, which come out directly from the molecular models and probably the data you already have, and you could probably even correlate all these things together. Same goes for other transport properties.
Q4: If you didn’t do pre-processing of data before training the neural network, do you think the neural network would have been as accurate? (I don’t remember exactly the equation you showed for pre-processing, but I think it had a division.)
Short answer, No. regularizing the data is super important. otherwise, you are trying to fit numbers over very large ranges (decades), and the results might “look” good in a statistical sense, but will not be really good. Think of on error of 1 unit in a number that is 0.01 and in a number that is 10000. clearly a different result. If you take the log, then the result is different!
Machine Learning with Causality: Solubility Prediction in Organic Solvents and Water – Dr Bao Nguyen (University of Leeds)
Dr Bao Nguyen is a Lecturer in Physical Organic Chemistry at University of Leeds, where he has been from September 2012. He actively collaborates with colleagues from both the School of Chemistry and School of Chemical and Process Engineering to address current challenges in process chemistry. He is a core member of the Institute of Process Research and Development (iPRD), a flagship institute set up by the Leeds Transformation Fund. Dr Nguyen did his PhD in Organic Chemistry at the University of Oxford, under the supervision of Dr John M. Brown FRS. He then moved to Dr Michael C. Willis’ group, where he developed the first Pd-catalysed coupling reaction employing sulfur dioxide by suppressing catalyst deactivation. Afterward, he joined Imperial College London, working in Dr King Kuok Hii’s group to delineate the nature of the palladium species in different catalytic reactions and developing separation methods for these species. He was awarded his first independent position as a Ramsay Memorial Fellow at Department of Chemistry, Imperial College London.
Q & A Session
Q1: On slide 15, what is the difference between water set_wide and water_set_narrow?
So, water is set wide is basically from logS -12 to 2. That’s a typical range of LogS you will see in the literature. Now, because we are comparing performance in water and in organic solvents, and you’ll notice that the distributions of solubility in organic solvents is much narrower, so we normally get somewhere between 1 and -4. So, when we want to compare between different solvents, then we use the water_set_narrow, so we basically truncate it down to -4 and we leave all details here out of it. But for water solubility alone, then we use water_set_wide.
Q2: Why do you prefer % within 1.0 log S, and .7 log S rather than R^2 and RMSE as your error measures?
So, the problem is that the experimental values are noisy, it can be wrong. Each of the experimental values can be wrong by up to +/-0.7 in LogS. So, if we usually ask where it would distort the goodness of fit, based on how accurate the actual experiment data is. So, let’s say for example if the experimental value is 0.2 and my predictive value is 0.5. I don’t know which one is correct. I don’t know which one is a real solubility because I don’t trust my experimental values that much. I know that is extremely noisy, so in those cases I can’t just rely on the R2 to tell me that my prediction is correct because the experimental values is not something I trust. And so we intentionally created the percentages in order to represent how much we should trust our predictions rather than just relying on the experimental data. This is this is going to be a common problem for all chemistry, most of our measurements are very noisy. Until we start using robotic systems and a sort of consistent protocols, I don’t think we’re going to solve that problem.
Q3: When you were deciding the number of descriptors to use, did you start with the most important descriptors first (slide 27) and add progressively less important descriptors?
In this case, the honest answer is no. The analysis of the importance of descriptor is after the fact. So, we came up with 22 descriptors that we think are really relevant to the solubility properties and then we did the PCA analysis and we did cross-correlation analysis that lead us to the removal of six that leave us with 14. It is only after we build models and look at the importance that we recognize that actually some of them are not important as someone there are more important. So, indeed, we remove the melting point for water solubility, and for water there are only 13 descriptors. But I think in a way you right so if we do this again and we have done for other predictions, other properties, then we do very early analysis of the importance and we did remove some of the less important one. So, this is normally what we had to do if we don’t have a lot of data, and unfortunately that that seems to be a common occurrence in chemistry.
Q4: Sometimes the consensus median was better than the consensus mean and other times it wasn’t so which consensus would you recommend using?
I had long discussions with my student on this. So, it depends on the wrong predictions. It’s basically that if the wrong prediction, is just slightly wrong, then mean and medians probably don’t differ that much. If a single wrong prediction is very far out then it would distort the mean, so I don’t think that’s a general conclusion there. We did try to sort out why in some cases means better and why some case medians better, but I don’t think I can confidently say one is better than the other, not really.
Q5: Is the consensus mean ever better than the consensus median of all the models’ results? Or, would it tell you something if these two values differ significantly?
We start looking at number for classes of compound, so we know which classes of compound we don’t predict well for and if you look at the mean and median prediction for that, it tells you a very quick story about whether it’s consistent for the whole class or it’s not. At least a few months ago we still struggle with a few. I mean, it turned out to be very difficult in water. I think we solved that problem now. But zwitterions are still a nightmare and we still haven’t got a solution for that. If you look at the mean and median for those and they will be predicted wrong and quite far out, and that basically says that the data we are feeding in is not sufficient to describe the complexity of the system. So, we’re dealing with speciation in equilibrium and aqueous conditions with pH influence. We’re going to have to give the models more data that represents those phenomena in order to cope with those type of compounds. And when you see both the median and mediums falling in the wrong range of predictions as well and that basically say that the models don’t get the data it needs.
Q6: Did you consider using other descriptor types in your research such as fingerprint bits or graph representations?
The answer is not for this one, and we purposefully avoided those 2D descriptors because we’ve seen hundreds of those papers already, and we know that they also did not manage to solve the solubility challenge. So we purposefully decided that rather than using fingerprinting fragment descriptor, we’ve got to take the whole molecule and we’ve got to rely on DFT to generate the descriptors we want. I think it is only for this specific case. With other types of prediction that we do, we do look at those descriptors. It depends on the problem at hand. The problem is that for a lot of the proper chemistry problems, for example reactivity and selectivity, they almost always come back to 3D shape and steric hindrance. In those cases, you can’t rely on 2D structures anymore, you have to build the compounds and then you have to deal with conformations and all those things that we normally try to avoid. Those are difficult problem to deal with. On the solubility challenge I can say at the moment we can probably predict about 80% of the compounds in in the first challenge, reliably. We haven’t tried it on the second challenge here because we want to make sure that we ready before we tackle that one.
